DAC Danaos Corporation
Container · Container / Capesize · 100 documents
Danaos Corporation's 87-vessel container fleet — 76 Container and 11 Capesize — has no fleet-rate estimate this quarter. The fleet is chartered out at fixed rates, so there is no spot market to price the open days against. Its dividend is still forecast at $0.90 a share for 2026Q3, by declared rate held flat (PATTERN).
Yields annualise each quarter ×4 at the last close, $158.17 (2026-10-16). Our model is not company guidance.
What will Danaos Corporation pay for 2026Q3?
Rates in, dividend out 2026Q3
Model Your scenarioSet a rate per vessel class and the statement below re-prices: our model’s figures in one column, yours beside them. These are your numbers, not our forecast and not company guidance; nothing you set is saved.
Latest rates
| Class | Company earned | Booked 2026Q3 | Market now | 8 weeks |
|---|---|---|---|---|
| Capesize · 11 | $35,5222026Q2 · fleet avg | —none printed | —no open $/day series |
Company earned: the issuer’s own reported TCE (linked). Booked: cover the issuer printed for 2026Q3. Market now: the median across the broker route prints we hold for the class — a derived blend, not a vendor index; the trend is rebased to 100 eight weeks ago.
Your rates every day is at your rate
2026Q3 P&L and cash
| Line | Model | Your scenario | Δ | ||||||||
|---|---|---|---|---|---|---|---|---|---|---|---|
Vessel-days, days modelledShips on the fleet list × the quarter's calendar days for capesize: no off-hire or drydock days are deducted there. Priced classes only: the estimate has no rate for Container, so those days are left out. |
1,012 | 1,012 | |||||||||
By class
| |||||||||||
| Fleet TCE, $/day | 47,050 | 47,050 | |||||||||
Revenue (TCE basis), $m modelledVessel-days × fleet TCE. |
47.6 | 47.6 | |||||||||
Vessel opex, $m assumed2026Q2: $56.7m over 7,912 vessel-days, held per day. Source (2026Q2) |
(7.3) | (7.3) | |||||||||
G&A, $m assumed2026Q2: $14.9m over 7,912 vessel-days, held per day. Source (2026Q2) |
(1.9) | (1.9) | |||||||||
| EBITDA, $m assumed | 38.5 | 38.5 | |||||||||
Hire for chartered-in ships, $mNot on file for any quarter (not extracted, or not disclosed). |
— | — | |||||||||
Interest expense, $m assumed2026Q2: $8.1m over 7,912 vessel-days, held per day. Source (2026Q2) |
(1.0) | (1.0) | |||||||||
Scheduled debt amortisation, $m stated2026Q2: $6.7m over 7,912 vessel-days, held per day (the issuer’s scheduled principal). Source (2026Q2) |
(0.9) | (0.9) | |||||||||
Drydock cost, $mNo separate drydock cash line on file. |
— | — | |||||||||
Cash break-even, $/day assumedΣ cash costs above ÷ vessel-days. |
10,912 | 10,912 | |||||||||
| Cushion vs fleet TCE, $/day | 36,138 | 36,138 | |||||||||
Free cash flow to equity, $m assumedRevenue − cash costs: the cash available for distribution. |
36.6 | 36.6 | |||||||||
Maintenance capex, $mNot disclosed as a cash line; not in the model’s cash. |
— | ||||||||||
Dividend policy pattern
No stated payout policy on file.
Dividend by declared rate held flat; it does not move with the rate, so your scenario leaves it unchanged.
| Output | Model | Your scenario | Δ |
|---|---|---|---|
| Estimated DPS, $/share pattern | $0.90 | ||
| Forward yield, run-rate % | 2.3% | ||
| vs last declared ($0.90, 2026Q2) | +0% |
Not in the box: Container — no market rate or guidance prices this class (see the model's gaps).
Yield annualises the quarter’s DPS × 4 (a run-rate, not a forecast of the year) against the $158.17 close on 2026-10-16.
This dividend is set by declared rate held flat, not by the rate — your scenario moves the cash line, not the DPS.
Showing the model’s own figures. Setting your own rates needs JavaScript.
Dividend per share declared · model
Market context — rates, the dividend, and the price
Dividend — declared and forecast
Solid bars are declared distributions. Dashed-outline bars are the model estimate — see Dividend forecast. Model estimate — not issuer guidance.
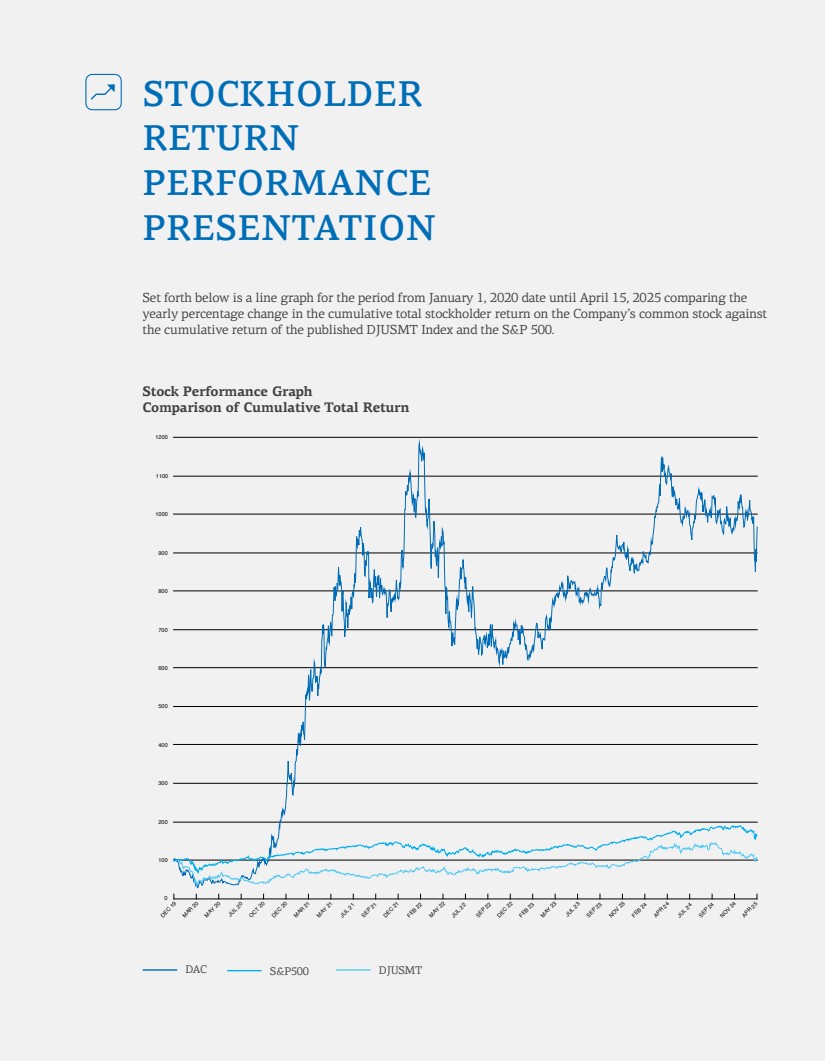
Forward (our model — model quarter ×4): $3.60/yr · @ $158.17 (as of 2026-10-16) = 2.3% yield (spot-exposure scenario) · Trailing TTM $3.6/yr = 2.3%
Next-quarter fleet TCE: — (container: charter-out fleet earns fixed TC per the fleet list (owner 2026-09-05) — no lane spot proxy, estimate stays dark without issuer fixed-coverage guidance)
How we got the number
Earnings bridge — 2026Q2 → 2026Q3
Dividend history & forecast accuracy
Upcoming
| Quarter | Ex-date (est.) | Forecast DPS | Actual DPS |
|---|---|---|---|
| 2026Q3 E | — | $0.90 | — |
| 2026Q4 E | — | $0.90 | — |
| Period | DPS | Kind | Ex-date | Pay date | Source |
|---|---|---|---|---|---|
| 2026-Q1 | $0.90/share | regular | — | 2026-06-04 | as of 2026-05-12 declaration |
| 2025-Q4 | $0.90/share | regular | — | 2026-03-04 | as of 2025-11-18 declaration |
| paid 2025-08-28 | $0.85/share | regular | — | 2025-08-28 | as of 2025-08-28 declaration |
| paid 2025-06-05 | $0.85/share | regular | — | 2025-06-05 | as of 2025-06-05 declaration |
| paid 2025-03-05 | $0.85/share | regular | — | 2025-03-05 | as of 2025-03-05 declaration |
DPS method: declared rate held flat.
Financials & fleet
Latest quarter 2026Q2 2 qtrs old
11× capesize · 76× container current
Fleet model — 2026Q3
Fleet model estimate — not issuer guidance.
| Class | Ships | TC | Spot | % Fixed | Guided $/d | Spot $/d | Blended $/d | QTD rev $M | Modeled Q rev $M |
|---|---|---|---|---|---|---|---|---|---|
| Container | 76 | — | — | — | — | — | — | — | — |
| Capesize | 11 | — | — | — | — | — | 47,050 | — | 47.6 |
| Total | 87 | 47,050 | — | 47.6 | |||||
Guided rates are issuer-booked cover for 2026Q3 blended with SSY capesize assessments for the open days.
Bear uses booked coverage only; Base prices open vessels at the company's own last realized fleet rate — no market index covers this fleet, so there is no peak-index Bull case.
Declared $0.90 in each of the last 4 quarters — the forward figure is the rate itself, not a TCE-linked model. Coverage below shows how far modelled cash after debt service goes toward it.
Model gaps & assumptions
container: charter-out fleet earns fixed TC per the fleet list (owner 2026-09-05) — no lane spot proxy, estimate stays dark without issuer fixed-coverage guidance · container: no market proxy prices this class and no issuer guidance on file -> class estimate stays dark · capesize: SSY Capesize Index SPOT proxy $47,050/day (our mean of 2026Q3's monthly medians across the SSY T/C routes, 3/3 months, 48 weekly print(s); the quarter has ended, so it is priced at its own months; route values are licensed and not shown; no Gibson route for dry class) · index realization not applied to the cape classes: fewer than 2 closed quarters with this issuer's own cape TCE on file — the open share is priced at the full index, which this issuer has not been shown to capture · capesize: no fixed-coverage guidance -> 100% spot proxy · fleet TCE covers the proxied classes only (capesize) — dark classes (container) carry 87% of the fleet's vessel-days on file and dominate it; no fleet TCE (missing input: per-class market proxies) · estimate base 2025Q4 predates 2026Q2, the quarter before the 2026Q3 forecast · DPS is the declared rate: $0.900 in each of 4 quarters (2025Q3, 2025Q4, 2026Q1, 2026Q2) — held flat, so it is not modelled from TCE
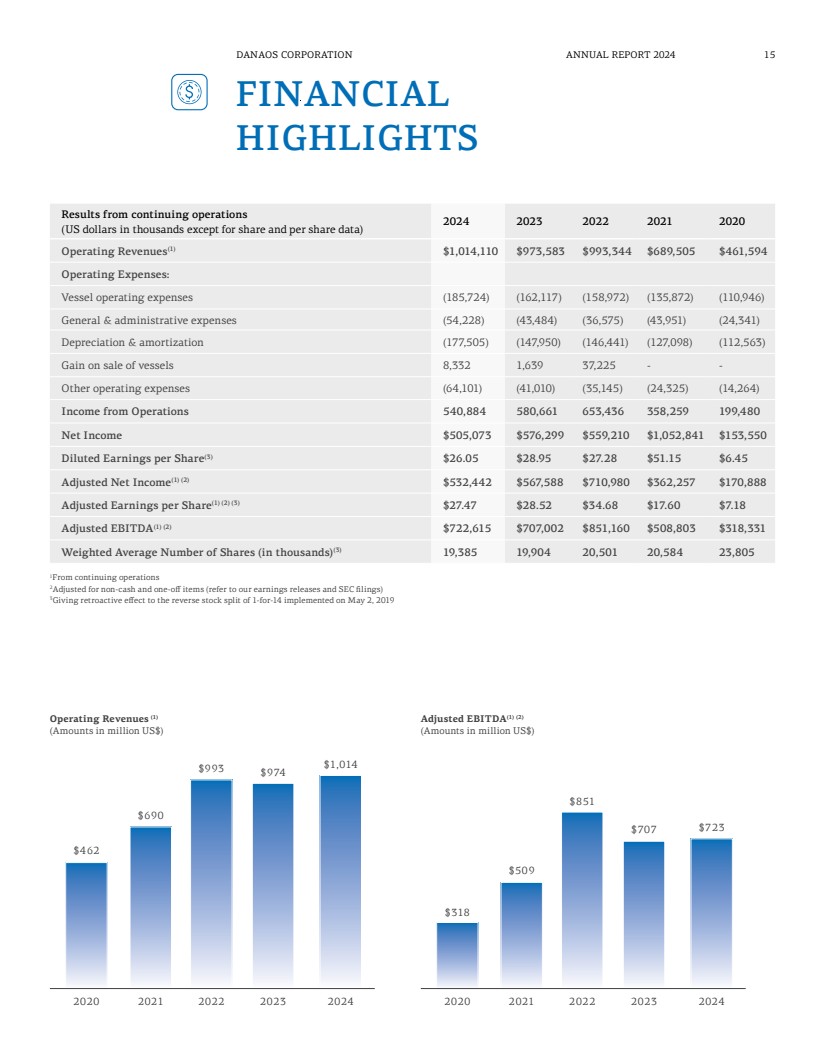
Profit statement highlights
| Line | 2026Q2 | 2026Q1 | YoY Δ |
|---|---|---|---|
| Revenue | $274.4M | — | +4.7% |
| Opex | $56.7M | — | — |
| Net income | $151.8M | — | +16.0% |
reconciliation: insufficient data for an earnings bridge (2026Q2) earnings bridge incomplete — treat income-derived figures as provisional
Full P&L grid — 6 quarters
| Line item | 2026Q2 | 2026Q1 | 2025Q4 | 2025Q3 | 2025Q2 | 2025Q1 |
|---|---|---|---|---|---|---|
| Revenue $M | 274.4 | — | — | — | 262.2 | — |
| Voyage expenses $M | — | — | — | — | — | — |
| Vessel opex $M | 56.7 | — | — | — | — | — |
| G&A $M | 14.9 | — | — | — | — | — |
| Depreciation $M | — | — | — | — | — | — |
| Interest expense, gross $M | — | — | — | — | 9.7 | — |
| Net income $M | 151.8 | — | — | — | 130.9 | 115.1 |
| Declared DPS | 0.90 | 0.90 | 0.90 | 0.90 | 0.85 | 0.85 |
Realized fleet TCE
Realized fleet TCE versus benchmark: 1 points, 2026-04-01 to 2026-04-01; Realized fleet TCE latest 35,522.00.
Benchmark comparison will appear once issuer-printed benchmark data is available.
Guidance & sources
Issuer guidance — forward-looking
| Period | Metric | Value | Coverage | As of | Source |
|---|---|---|---|---|---|
| 2027FY | Container charters expiring (vessels) | 18 vessels | — | 2026-08-04 | |
| 2027FY | Contracted revenue (USD m) | 967.8 USD millions | — | 2026-08-04 | |
| 2028FY | Container charters expiring (vessels) | 14 vessels | — | 2026-08-04 | |
| 2029FY | Container charters expiring (vessels) | 16 vessels | — | 2026-08-04 | |
| 2030FY | Container charters expiring (vessels) | 6 vessels | — | 2026-08-04 | |
| 2031FY | Container charters expiring (vessels) | 12 vessels | — | 2026-08-04 | |
| 2032FY | Container charters expiring (vessels) | 3 vessels | — | 2026-08-04 |
Historical guidance (1 rows)
| Period | Metric | Value | Coverage | As of | Source |
|---|---|---|---|---|---|
| 2026FY | Container charters expiring (vessels) | 7 vessels | — | 2026-08-04 |
Sources — press, filings & documents
Interim updates since 2026Q3
- vessel purchase high 2026-10-09 four Newcastlemaxes under construction scheduled to be delivered in 2028. source
- fleet composition low 2026-10-09 The Company’s dry bulk business, for which Danaos Bulk Inc. acts as the holding company, currently comprises 11 Capesize vessels on-the-wate… source
- fleet composition low 2026-10-09 The Company’s dry bulk business, for which Danaos Bulk Inc. acts as the holding company, currently comprises 11 Capesize vessels on-the-wate… source
- other low 2026-10-09 Danaos Corporation (“Danaos” or the “Company”) is exploring a carve-out and sale of a minority stake in its dry bulk segment, and has mandat… source
Market:
Press & filings by quarter










Recent documents
- edgar 2026-10-09 FORM 6-K (2026-10-09)
- edgar 2026-08-04 FORM 6-K (2026-08-04)
- edgar 2026-08-04 FORM 6-K exhibit (2026-08-04)
- edgar 2026-08-04 FORM 6-K exhibit (2026-08-04)
- edgar 2026-08-04 FORM 6-K exhibit (2026-08-04)
- edgar 2026-08-04 FORM 6-K exhibit (2026-08-04)
- edgar 2026-06-18 6-K — Current Report (2026-06-18)
- edgar 2026-06-18 6-K exhibit (2026-06-18)
- edgar 2026-06-18 6-K exhibit (2026-06-18)
- edgar 2026-06-18 6-K exhibit (2026-06-18)
- edgar 2026-06-18 6-K exhibit (2026-06-18)
- edgar 2026-06-18 6-K exhibit (2026-06-18)